Measuring platform engineering: is the platform team actually working?
You staffed a platform team to make every other team faster, and nothing in the organization measures whether it did. Provisioning counts will not settle it, and neither will a better report. What settles it is running the platform the way a product team runs a product: ask the teams you serve, measure whether their work got easier, change what did not land. This page has the adoption pulse and the wrong-problem signals, free to copy. It ends with how Aurora Coach coaches a platform team into those practices, shown on a worked example.
A platform team is a product team with captive customers
Provisioning is what gets reported: accounts created, repositories migrated, services onboarded. Those numbers rise whether or not the platform is helping, and they keep rising after it has stopped.
The failure mode is rarely a bad platform. It is a competent platform solving a problem the teams do not have, adopted on paper and worked around in practice. In Team Topologies, Skelton and Pais argue for a thinnest viable platform: only what measurably accelerates other teams, treated as a product with users who could choose otherwise. Your users cannot choose otherwise. They can only route around you, and that is the one thing your dashboards will never show.
Nobody files a ticket to say they routed around you. They build their own and move on.
The platform adoption pulse, free
Six questions, asked of the teams the platform serves rather than the platform team. Run it per team; an average across ten teams hides the two that have given up.
- What have you built yourself that the platform was supposed to give you? The single most informative question, and the one platform teams almost never ask. Every answer is a feature that exists twice and a team that decided asking was slower than building.
- Last time you hit a wall with the platform, what did you do? Filed something, asked someone, worked around it, or gave up. The ratio matters more than any individual story, and only one of those four generates a ticket you would ever see. The wider version of this question is a developer experience survey.
- What is the platform genuinely better at than what you would do alone? Ask for the positive case. A team that cannot name one thing is complying with the platform, not adopting it, and the difference is invisible in usage numbers.
- What would you lose if it disappeared on Monday? A cleaner read on real value than any satisfaction score. "We would be fine in a week" and "we could not deploy" are both useful answers and both actionable.
- How long from wanting something to having it? Time it end to end, from the first ask to the thing running, not from when a ticket was opened. Track the two paths separately: what a team can serve itself, and what has to come through you. The gap between those two numbers is what decides architecture.
- What have you stopped asking for? The silent end state of a platform that says no too often. Teams stop requesting, stop complaining, and stop counting as dissatisfied, which reads from the inside as things having settled down.
Four signals a platform is solving the wrong problem
Four signs you are building for a customer you have stopped listening to. None is fatal on its own and none shows up in a usage dashboard. Two or more together is worth a conversation before the next roadmap.
- Adoption is mandated rather than chosen A platform good enough to want does not need a policy. Mandates are worth using deliberately, but they also destroy the only honest adoption signal you had.
- The roadmap comes from the platform team Platform roadmaps built from internal conviction drift toward interesting problems. If you cannot trace the last three items to a specific team that asked, the drift has already happened. The delivery-wide version of the same drift is output vs outcome.
- Usage is broad and shallow Count the teams that would be blocked tomorrow if the platform went away, not the teams that have an account. If the second number is much larger, the platform owns the easy first step and none of the work that follows it.
- The strongest teams are the least engaged The most damaging signal on the list. The teams most capable of routing around you are exactly the ones who will, and they are the teams whose time the whole investment was meant to multiply.
None of this is an argument against platform teams. It is an argument against funding one and never asking the served teams whether it arrived.
How do you measure a platform team?
Not by provisioning counts, which go up whether or not the platform helps. Measure what the served teams do when the platform is not looking: what they built themselves that the platform was meant to provide, what they do when they hit a wall, how long it takes to go from wanting something to having it, and what they would lose if it vanished. Those are the signals that move before adoption numbers do. The same ground is covered more formally, with Adoption and Measurement among its five dimensions, in the CNCF Platform Engineering Maturity Model.
What is platform engineering ROI?
The multiplication argument: an hour of platform work should save more than an hour across the teams it serves. It is usually a sound bet and it is almost never re-checked after funding, because the cost is visible in headcount and the return is spread thinly across teams that never attribute it. The practical version is to measure the return on the served teams rather than on the platform team.
Why do teams route around the internal developer platform?
Almost always speed rather than quality. If self-service takes minutes and anything outside self-service takes weeks, teams will design around what they can get today, and a strong team can usually build a narrow version of what it needs faster than it can wait for the general one. This rarely generates a complaint, which is why it goes unnoticed until a platform review finds two of everything.
Coaching a platform team into product practice
Simulated team · Real product output Keystone, the internal platform team at Aldermark Mutual, a fictional regulated insurer. Seven engineers, fourteen product teams, solid engineering, and a value case nobody can show. Watch what the coach works on with them. Not reporting, and not a metric to send upward: how they talk to the teams they serve, and how they know whether it landed. We scripted the inputs and ran them through Aurora Coach in production. Everything below is the product's real output.
1Sense and analyze
Everyone on the team answers structured questions in their own words, and can take any thread further in a check-in conversation. The answers roll up into one analysis of the team, with a score in each of six categories.
The question provisioning counts cannot answer
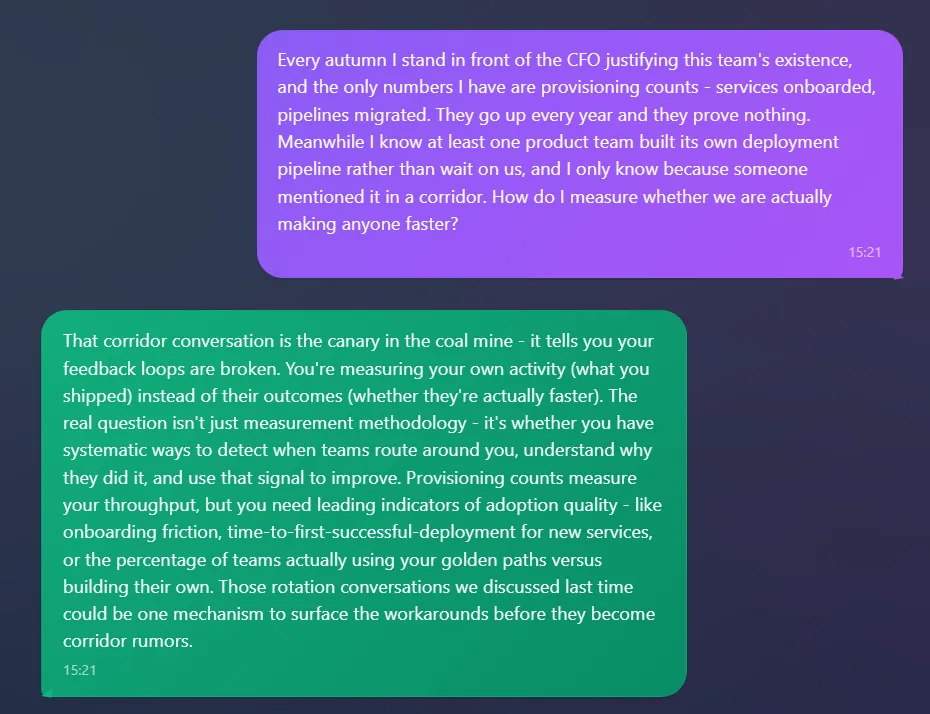
Cecilia leads Keystone. She brings the autumn budget conversation and the workaround she only heard about in a corridor. The coach's read: the corridor story is “the canary in the coal mine,” and provisioning counts measure “your own activity (what you shipped) instead of their outcomes (whether they're actually faster).” What replaces them is a short list of leading indicators of adoption quality: onboarding friction, time to first successful deployment, and how many teams use the golden paths versus building their own.
Finding the teams that never filed anything
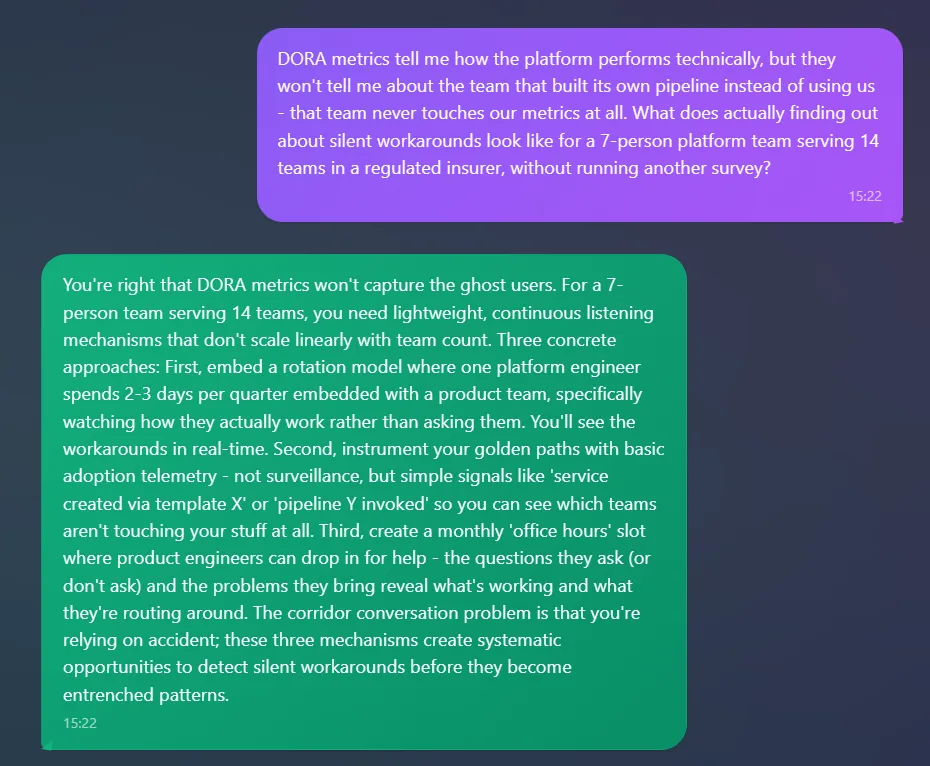
The next question is the practical one: DORA metrics never see the team that built its own pipeline, so what does finding the ghost users look like without another survey? Three mechanisms come back, none of them a survey: adoption telemetry on the golden paths that shows which teams touch nothing, a platform engineer embedded with a product team a few days each quarter to watch how they actually work rather than asking, and monthly office hours read for the questions teams ask and do not ask. “The corridor conversation problem is that you're relying on accident.”
The lowest of the six scores
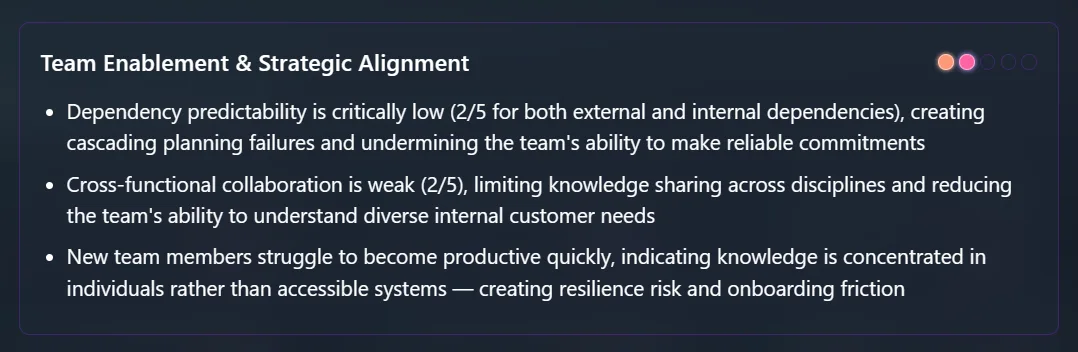
Team Enablement & Strategic Alignment came back lowest: count the filled dots, two of five. The reasoning names dependency predictability first, “critically low” for both external and internal dependencies and cascading into planning failures, and ends on knowledge concentrated in individuals rather than accessible systems.
2Recommend, refine, commit
The analysis comes with recommendations, and the recommendations become concrete suggestions the team votes on and commits to: twelve for this team. The AI informs the decision, it does not make it.
The measure that is actually about the customer
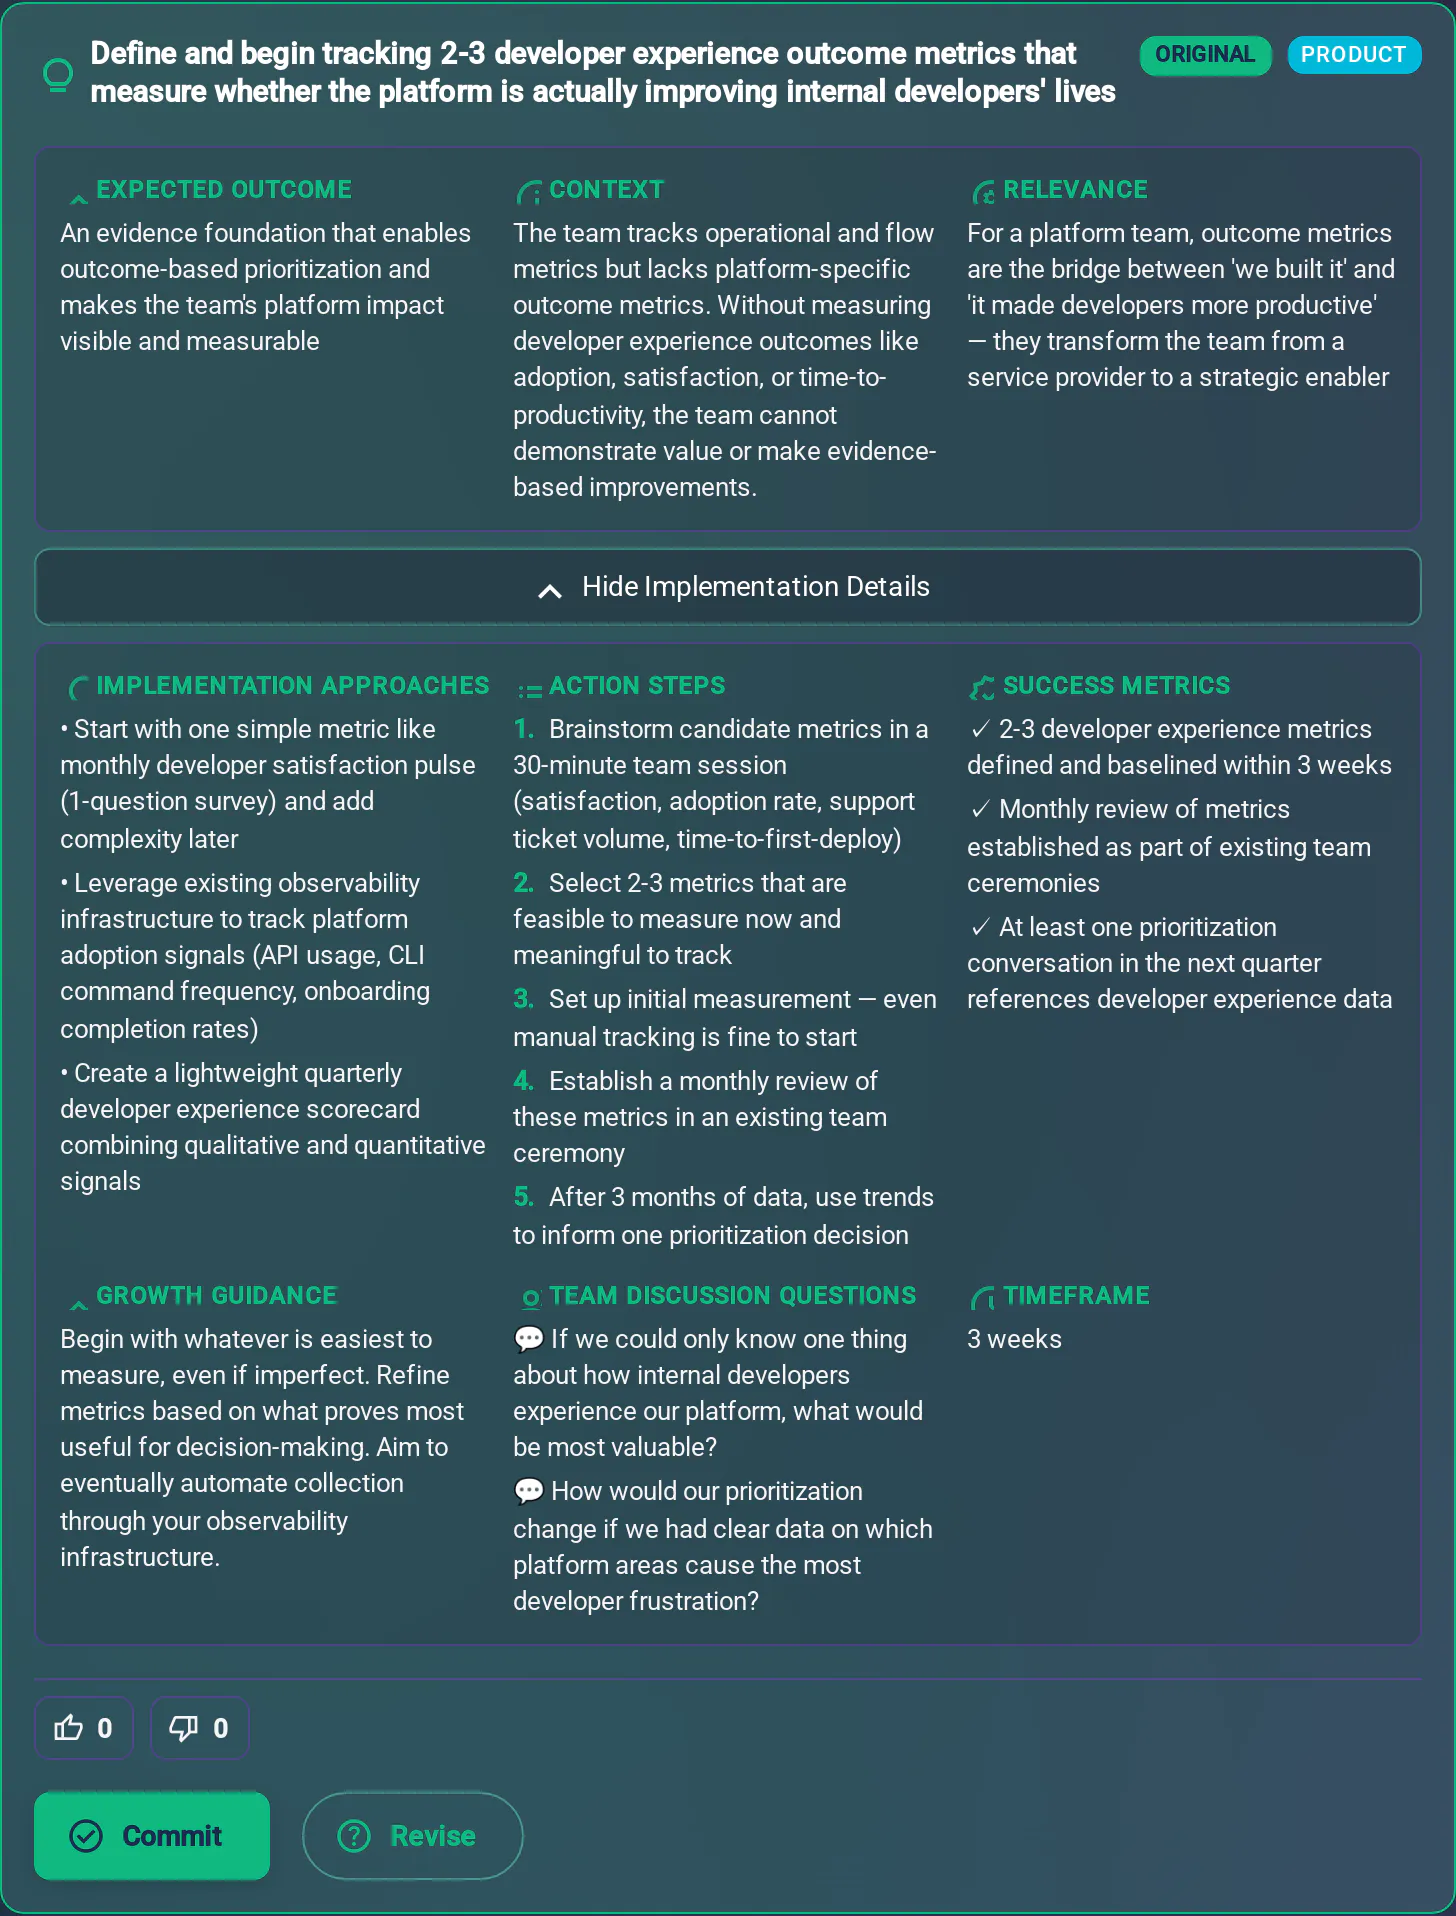
One of the twelve, in full: define and begin tracking two or three developer experience outcome metrics that measure whether the platform is improving internal developers' lives. Read the Relevance field, which argues from this team's own situation: “for a platform team, outcome metrics are the bridge between ‘we built it’ and ‘it made developers more productive’.” That is the product answer to the budget question, and it is a different thing from a report: it measures the customer, not the output. The questions above are general knowledge; this is what they become for one specific team.
3Execute and re-evaluate
The team does the work alongside delivery, and the next analysis shows whether the served teams noticed. Then the next change. One step per period is what turns a service desk into a product team, and the steps compound. Keystone has run one period. The trend view starts when the second one lands.
This is one use case. How the full product works is on the product overview.
Not ready to change anything today? You already have the adoption pulse and the wrong-problem signals above, copy buttons and all. If you want one improvement loop like these in your inbox each month, leave your email.
What this page cannot tell you is which of it applies to your team, this quarter. Aurora Coach works that out from your team's own words, recommends next steps with the reasoning, and the next period shows whether it held.
Both are free. The ROI mapper needs no signup and takes about two minutes. What team members write stays private to them: see AI governance.